
My 2025 with ChatGPT: What a "Year in Review" Doesn't Show
Originally published on LinkedIn.
As year-end reports flood our feeds, one thing that caught my eye was Your Year with ChatGPT. It is a fun recap, but I had a strong feeling there was more signal hiding behind those condensed numbers. So after the Christmas break, I exported my full 2025 ChatGPT history, did a lightweight analysis, and used it to reflect on my year.
A quick note on the data structure
Using one conversation as an example, the exported data forms a conversation tree stitched together by IDs. Each node contains not only the visible chat text, but also metadata that can include model outputs and traces of external retrieval (for example, search results metadata). The structure looks roughly like this:
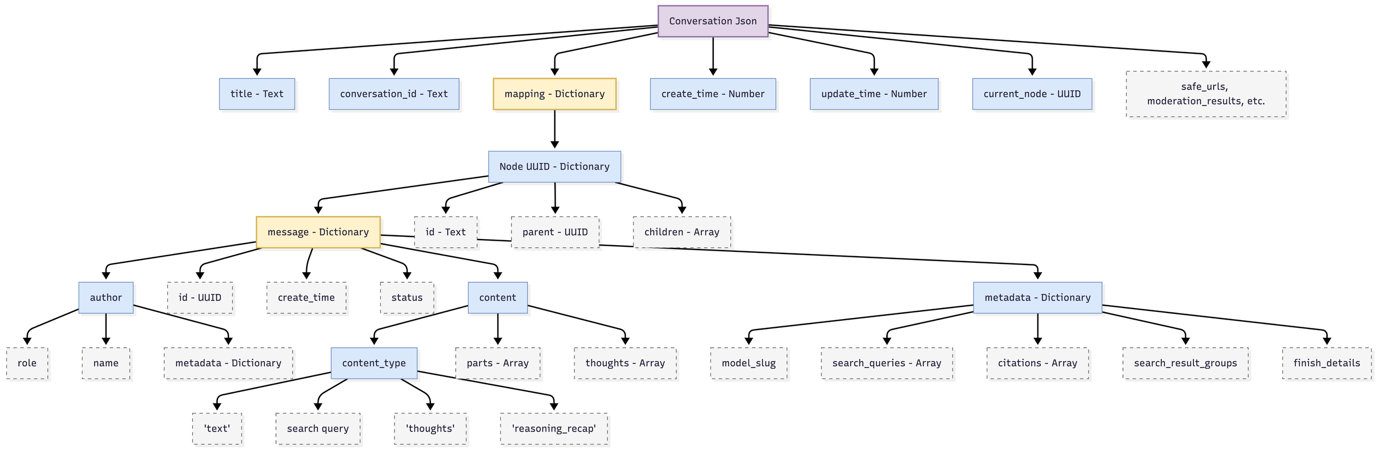
Below is my full-year recap.
1) My cadence: from casual to consistent
In January, I was just sampling. A few chats per week, nothing systematic. Over time, the curve climbed steadily. By mid-year, ChatGPT had become a daily tool. My “meaningful interactions” were often above 20 per week.
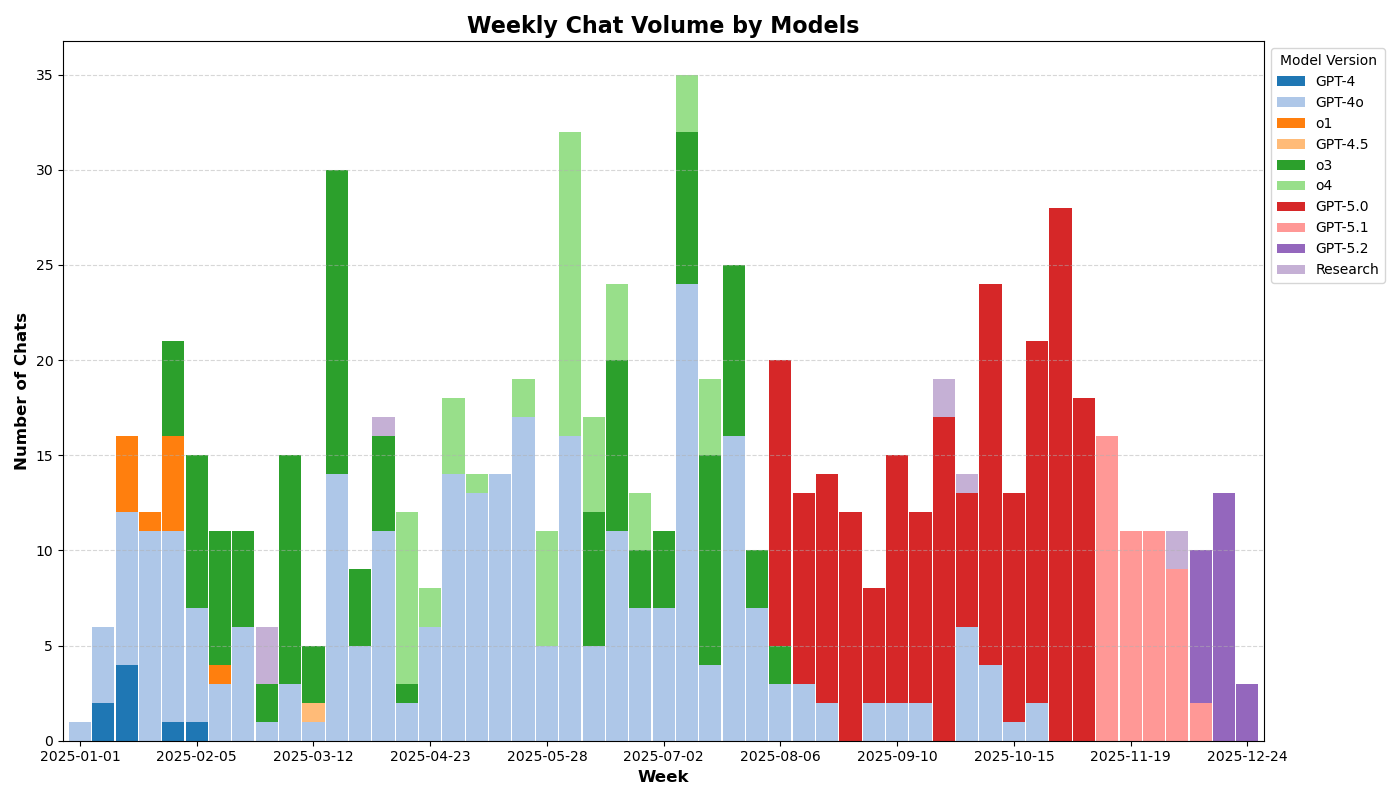
Usage in the second half of the year was strongly shaped by model updates and my own workflow shifts. After mid-November, as Gemini 3 launched, I moved a meaningful portion of tasks over to Gemini. Add the holiday season on top, and my ChatGPT usage dropped sharply in December.
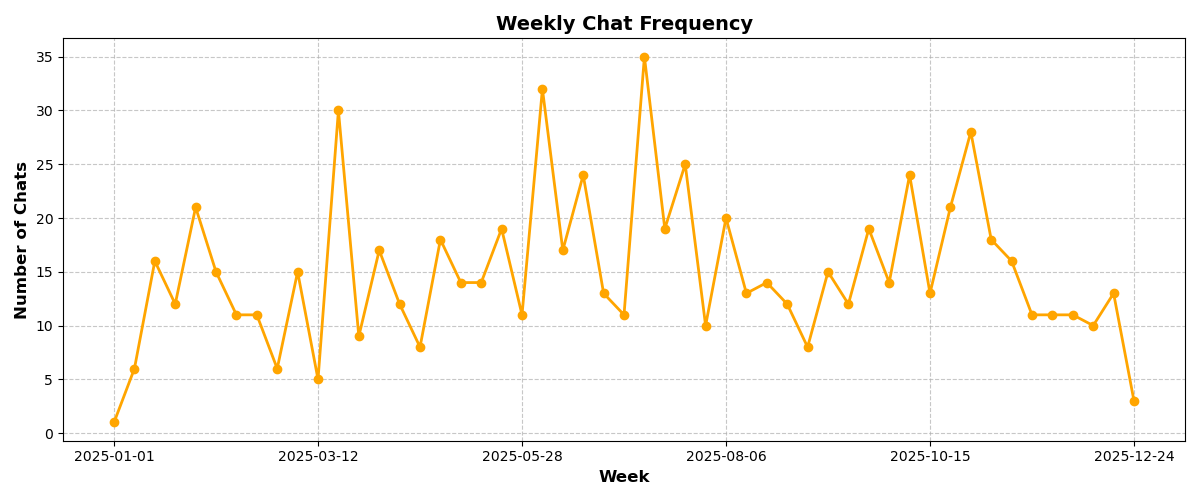
If the previous two years were about ChatGPT proving “what it can do,” then 2025 felt like a high-speed experiment in “what it can become.” I also noticed my model choices tracking product changes. This summer, I shipped a mock interview app powered largely by voice features, so 4o became my most-used model. Other models rose and fell in sync with what was available and what I needed at the time.
2) What I cared about: efficiency, efficiency, efficiency
What was I actually doing with all these chats?
After a semantic scan of my conversation history, one theme dominated: efficiency. I used ChatGPT as a practical assistant to reduce time spent searching, reading, cleaning, and drafting. Here is how my topics shifted week by week:
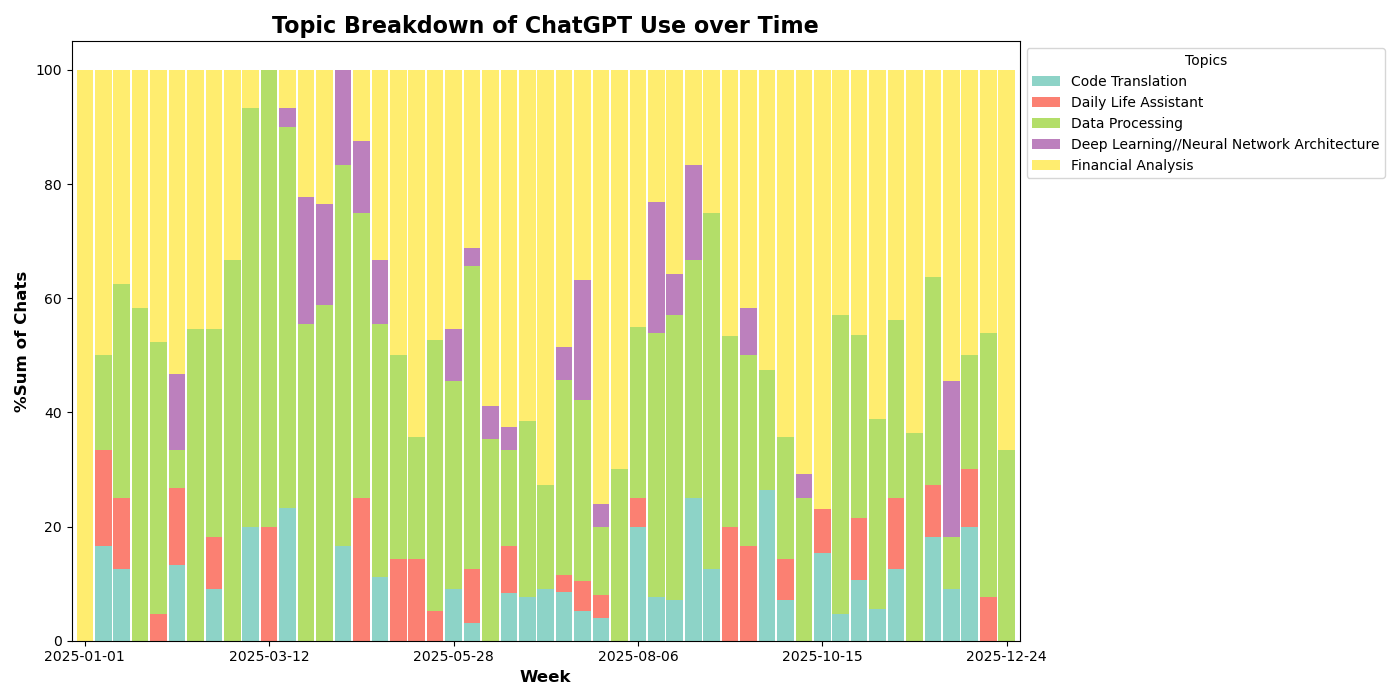
Two themes led most of the year:
- Financial Analysis: breaking down earnings reports from public companies, plus help with taxes and finance-related planning.
- Data Processing: batch cleaning for personal projects, plus prompt engineering and workflow iteration.
In these areas, ChatGPT mostly played the role of a junior analyst: helping me extract the signal from large reports and messy datasets, then turning it into something I can act on quickly.
Meanwhile, Deep Learning / Neural Network Architecture steadily grew as an interest area. Code Translation showed up heavily during debugging. Daily Life Assistant was mostly short queries and quick lookups.
3) What I really got: the hidden layer of information sources
One of the most interesting parts of the exported data is how it records URLs.
In my raw JSON, there are three URL-related fields that are worth studying and here is the key nuance. These fields are not the same thing, and they likely represent different stages of how links appear and how retrieved information may influence an answer.
safe_urls looks like a “system-approved or system-recorded” set of URLs that
appeared in the conversation. In other words, it is better interpreted as “URLs
that showed up and were considered safe to surface,” not as proof that the
model truly visited, read, or relied on them.
search_result_groups contains entries with snippets. That suggests the model
(or the system around it) at least saw titles and summaries. It is reasonable
to assume these summaries could influence the generated response, even if they
are not shown as final citations.
content_reference.sources appears to be the set of sources bound to the
citations you see in the final answer.
(There is also blocked_urls, but in my dataset it was empty.)
One detail I found especially interesting: some links in
content_reference.sources carried utm_source=chatgpt.com. It made me wonder
what this could mean for attribution, analytics, and the SEO landscape going
into 2026.
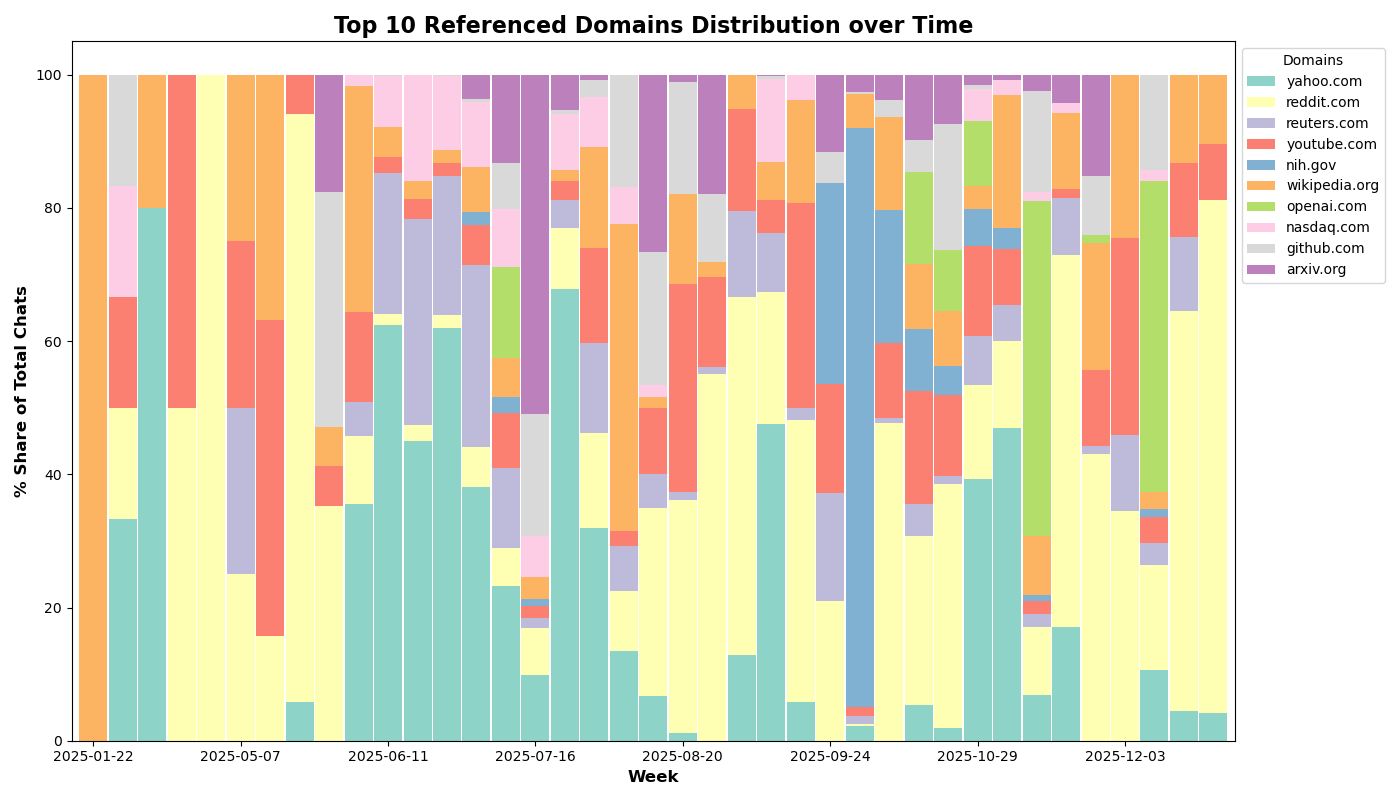
Finally, I used the domains inside search_result_groups to compute my top 10
domains of the year, then plotted how they changed week by week:
Closing thoughts
A year-end recap is entertaining, but the exported data shows a deeper story. For me, 2025 was less about novelty and more about turning LLMs into a daily productivity layer. As the boundary between search and generation blurs, evidenced by the SEO implications of those citation tags, 2026 promises to be even more disruptive. The tools are evolving, and so are we. Here’s to another year of optimized efficiency and new discoveries.