
Pallas Ads:
Read the Change Before You Act on It
Every Monday, growth teams ask why cost per click jumped. The answer sits scattered across Meta Ads Manager, Google Ads, TikTok Ads and exported spreadsheets.
A general-purpose AI agent can read these files and write a fluent answer. But fluency can hide a gap between what the numbers show and what the answer claims. A rise in cost per click makes that gap concrete.
A CPC increase that tells the wrong story
Take a hypothetical ad account with two campaigns. It buys 1,000 clicks in each of two weeks, yet its average cost per click (CPC) rises from $0.650 to $1.175, about 81%. A headline like that can invite a quick reading: costs are rising, so cut bids.
Both campaigns got cheaper, yet account CPC rose 81%
Account CPC is total spend divided by total clicks, so it follows the click mix.
Week 1
Account CPC
$0.650
Week 2
Account CPC
$1.175
Keep 1,000 total clicks and week 2 CPCs fixed: A costs $0.45 per click; B costs $1.90. Move clicks toward B to see the effect of a more expensive mix. A's share falls by the same amount.
Your mix · hypothetical
Account CPC
$0.595
below week 1's $0.650
| Week 1 clicks | Week 1 CPC | Week 1 spend | Week 2 clicks | Week 2 CPC | Week 2 spend | |
|---|---|---|---|---|---|---|
| Campaign A | 900 | $0.50 | $450 | 500 | $0.45 | $225 |
| Campaign B | 100 | $2.00 | $200 | 500 | $1.90 | $950 |
| Account | 1,000 | $0.650 | $650 | 1,000 | $1.175 | $1,175 |
Account CPC is total spend divided by total clicks, so it is a click-weighted average of the campaign CPCs. Campaign A got 10% cheaper per click and Campaign B 5% cheaper, but Campaign B’s share of clicks rose from 10% to 50%. The slider isolates that mix effect: campaign CPCs and total clicks stay fixed, while A’s share is always 100% minus B’s. We vary B because it is the more expensive campaign; changing A would show the same relationship in reverse. At B’s original 10% share, week 2 prices give an account CPC of $0.595, lower than week 1.
These numbers establish three things: each campaign’s CPC fell, clicks moved from Campaign A to Campaign B, and the same number of clicks cost $525 more. They do not establish why clicks moved; a budget change, a delivery shift or a deliberate choice would all fit. Nor do they say whether Campaign B’s clicks are worth more than Campaign A’s, or whether the account is doing better or worse for the business.
Cheaper clicks do not automatically mean better business outcomes, and pricier clicks are not automatically worse.
What Pallas helps you establish
We built a 14-day synthetic file from these numbers and ran it through Pallas. The report states what changed. It splits the change into campaign-level cost and click mix. It also lists the evidence still missing before anyone makes a business decision.
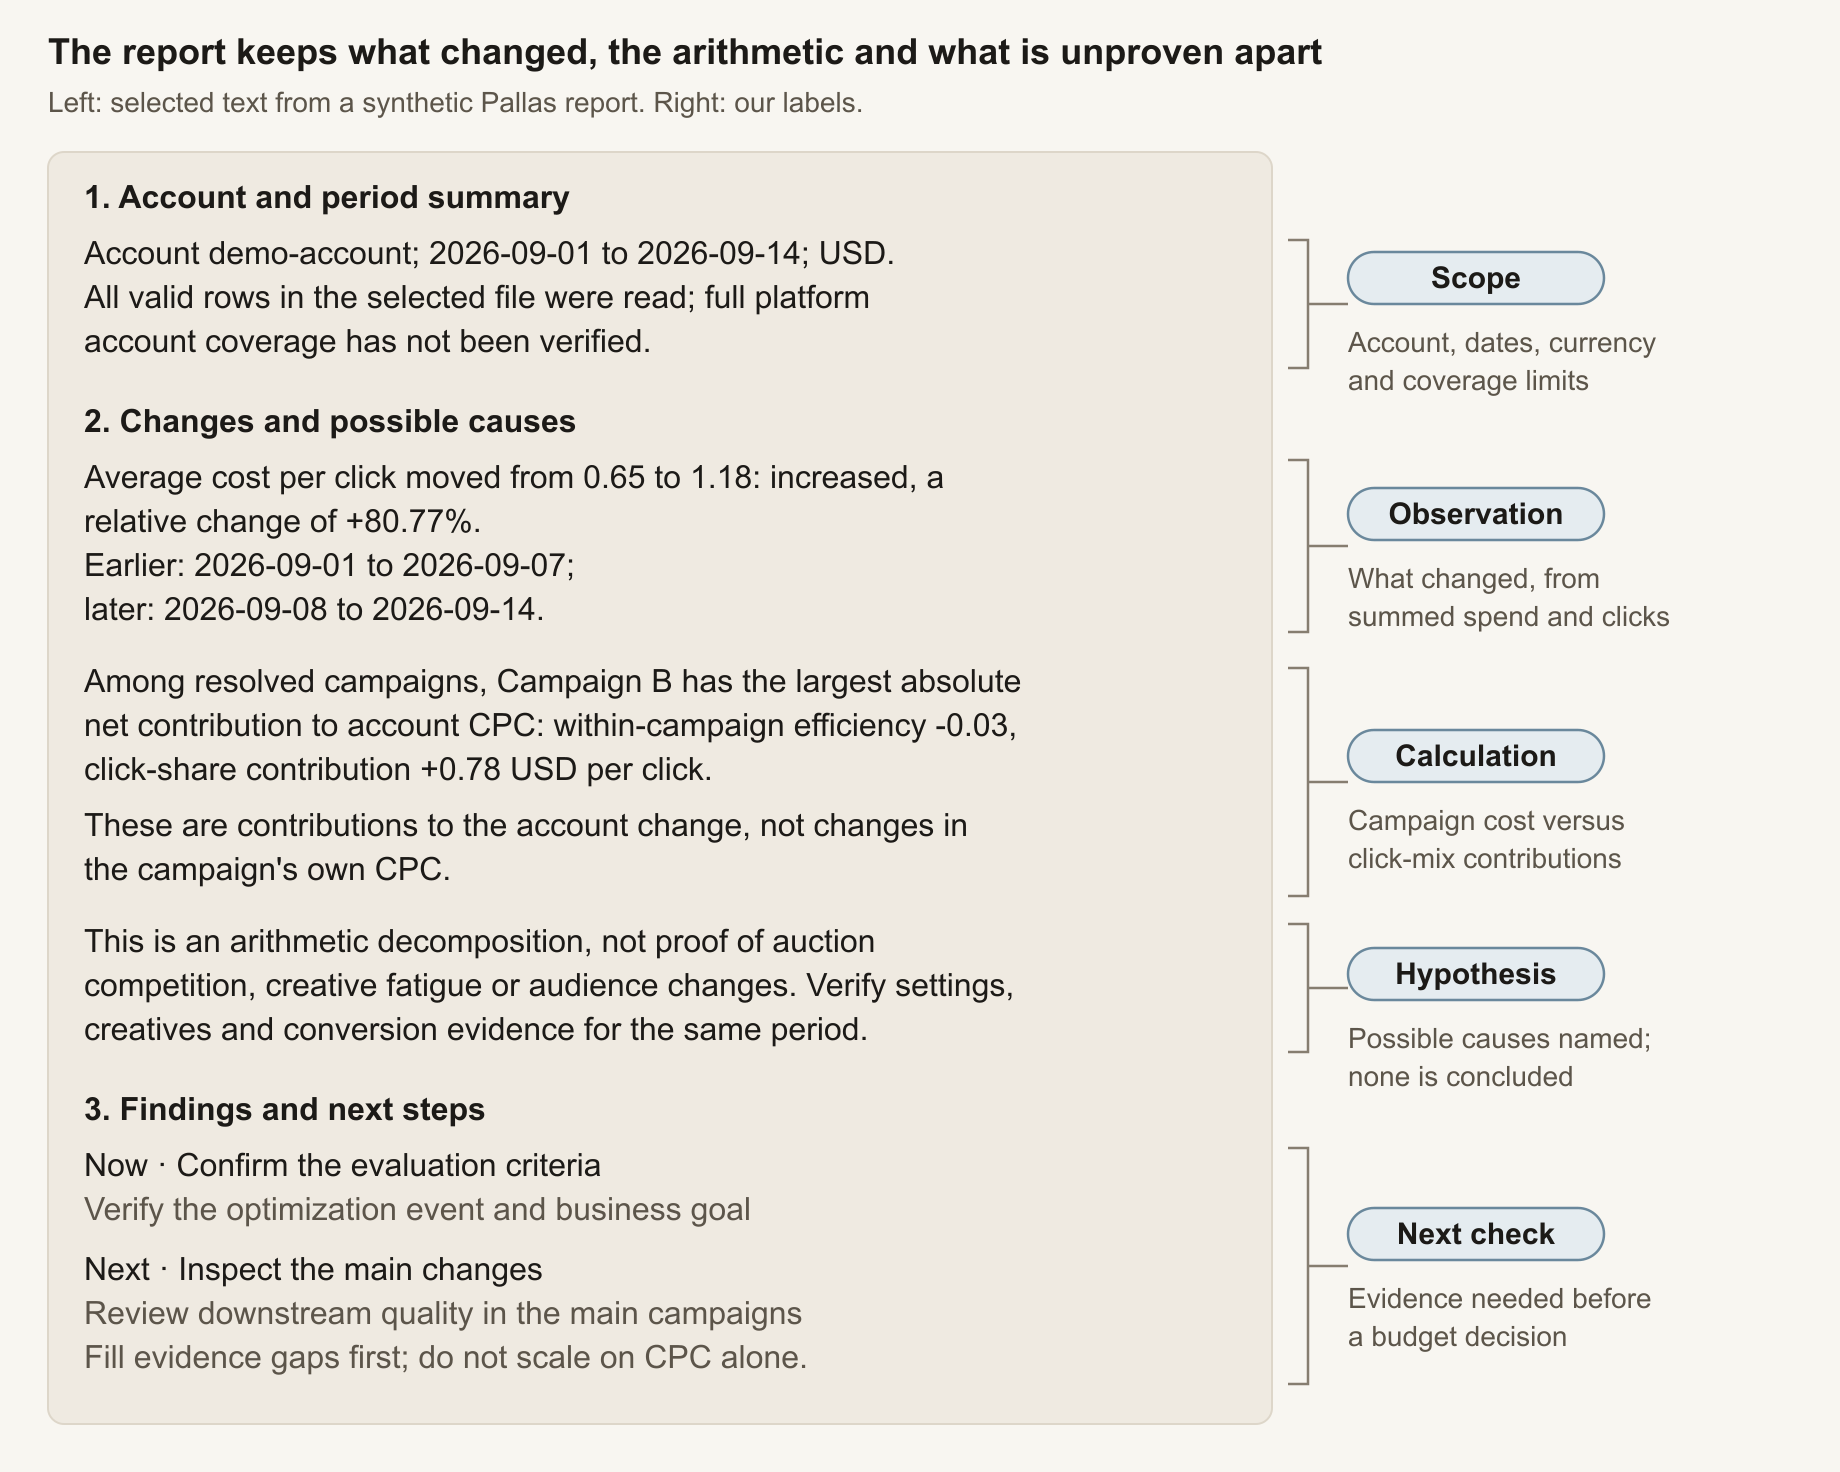
Across both campaigns, lower costs within each campaign pulled account CPC down by about $0.065 per click, while the shift in click share pushed it up by about $0.590. Both campaigns had the same click-through rate (CTR), so when the report splits CPC into cost per thousand impressions (CPM) and CTR, the whole rise lands on CPM. Here, account CPM rose only because clicks moved to the pricier campaign, which is why the report calls the split arithmetic and not proof of auction competition.
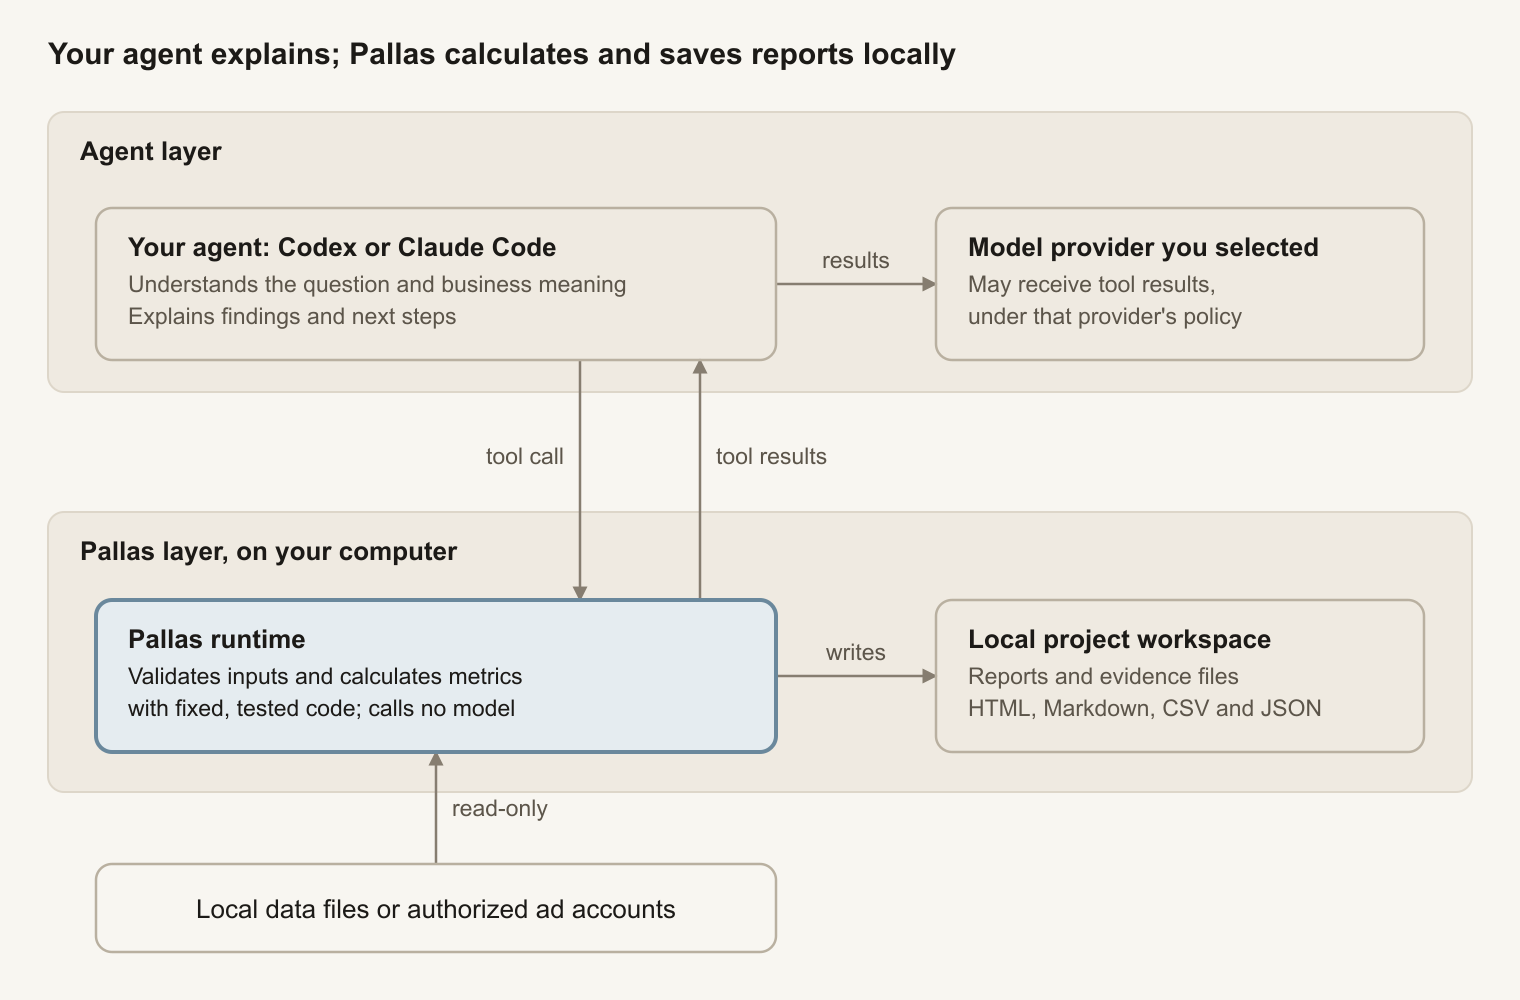
Pallas works inside the agent you already use, such as Codex or Claude Code. Each run leaves a local HTML report, a Markdown summary and CSV and JSON evidence files linked from the report. You can check each number against its evidence instead of trusting a sentence.
Why the model talks and the code counts
Pallas splits the work in two. The agent understands the question, helps clarify what it means for the business and explains the findings. Pallas validates the inputs, calculates the metrics with fixed, tested code and writes the report with its evidence; the Pallas runtime does not call a language model itself.
We chose this split because the two jobs need different things. An explanation can improve as agents improve, but metrics such as account CPC should come out the same from the same data, whatever the conversation or the wording of the prompt. So rules such as computing ratios from summed totals, keeping missing days as unknown rather than zero and comparing only like with like run as code every time.
Fixed calculations make results repeatable and checkable. They do not guarantee a correct business interpretation, and they do not turn an explanation into a cause. That takes context the ad data does not contain.
From click costs to business value
Back to the example: whether moving clicks to Campaign B was worth it is a business question, not a CPC question. Three connected questions get closer to an answer.
What is each campaign trying to achieve?
If Campaign B optimizes for purchases and Campaign A for app installs, comparing their CPCs says little. Pallas reads the campaign objective separately from the ad set or ad group optimization goal and event. It judges each goal by its own metrics rather than holding every campaign to one cost per acquisition (CPA) target.
Pallas identifies the product from app and store links in the source data and from product bindings you confirm, not from campaign names. It asks you only for business facts that are missing or ambiguous.
Do acquired users convert, pay and stay?
To see what happened in your own systems, you can add an export from your product, CRM or MMP, aggregated by date and channel: new users, conversions, revenue and retention. You confirm what each channel means: paid, organic, excluded or unknown. Unknown is never forced into paid or organic.
Rows match only on dates present in both files, the mapped platform and exact campaign IDs, never on campaign names. Pallas then shows internal customer acquisition cost (CAC), cost per internal conversion and revenue to spend. In the example, this is where you would see whether Campaign B’s extra clicks became paying users.
Paid and organic user quality is compared only when each group has at least 30 new users, and the difference is presented as descriptive. Platform-reported and internal conversions follow different attribution, so Pallas shows their ratio and never adds them.
Are the numbers comparable?
The same care applies across platforms. Pallas shows cross-platform conversion totals, CPA and return on ad spend (ROAS) only when the conversion event, attribution window, counting method and value currency match. Spend, impressions and clicks still compare, with each currency summed separately; reach is never added across platforms, because the same person can be reached on more than one.
All of this is aggregate matching. It is not user-level attribution, not a measurement of incrementality and not deduplication of unique customers across platforms.
Current boundaries and data handling
Pallas is an early Alpha, built primarily for macOS. Windows 11 x64 is a preview that still needs testing on Windows 11 desktops, including browser authorization.
Google Ads and TikTok Ads accounts can be read after you authorize in the browser, subject to platform permissions. Google app verification is still pending, but it does not stop you from connecting.
In Claude Code, you can connect Meta accounts through Meta’s official connector, though full reconciliation of Meta figures is still in progress. In Codex, that connector currently has a page display issue during sign-in, so connecting Meta may fail. In either agent, Meta exports can be analyzed as local data files.
Pallas is read-only: it cannot change campaigns, budgets or bids. Reports, evidence and imported data stay in a local project workspace, and Pallas sends no telemetry. Tool results return to your agent and may reach the model provider you selected, under that provider’s data policy.
Try it with one question
Start with one question about your own account or a local data file:
Account CPC rose last week. How much came from campaign costs and how much from click mix, and what should I check before changing budgets?
To see what comes back, inspect a synthetic sample report; it also shows matching against internal conversion data. To run Pallas yourself, follow the installation guide. The Pallas website has the overview, and questions are welcome by email.